contentTracing
Collect tracing data from Chromium to find performance bottlenecks and slow operations.
Process: Main
This module does not include a web interface. To view recorded traces, use
trace viewer, available at chrome://tracing in Chrome.
You should not use this module until the ready event of the app
module is emitted.
const { app, contentTracing } = require('electron')

app.whenReady().then(() => {
  (async () => {
    await contentTracing.startRecording({
      included_categories: ['*']
    })
    console.log('Tracing started')
    await new Promise(resolve => setTimeout(resolve, 5000))
    const path = await contentTracing.stopRecording()
    console.log('Tracing data recorded to ' + path)
  })()
})
Methods
The contentTracing module has the following methods:
contentTracing.getCategories()
History
| Version(s) | Changes |
|---|---|
None | This method now returns a Promise instead of using a callback function. |
Returns Promise<string[]> - resolves with an array of category groups once all child processes have acknowledged the getCategories request
Get a set of category groups. The category groups can change as new code paths are reached. See also the list of built-in tracing categories.
NOTE: Electron adds a non-default tracing category called
"electron". This category can be used to capture Electron-specific tracing events.
contentTracing.startRecording(options)
History
| Version(s) | Changes |
|---|---|
None | The |
None | This function now returns a callback |
Returns Promise<void> - resolved once all child processes have acknowledged the startRecording request.
Start recording on all processes.
Recording begins immediately locally and asynchronously on child processes as soon as they receive the EnableRecording request.
If a recording is already running, the promise will be immediately resolved, as only one trace operation can be in progress at a time.
contentTracing.stopRecording([resultFilePath])
History
| Version(s) | Changes |
|---|---|
None | This method now returns a Promise instead of using a callback function. |
None | The |
resultFilePathstring (optional)
Returns Promise<string> - resolves with a path to a file that contains the traced data once all child processes have acknowledged the stopRecording request
Stop recording on all processes.
Child processes typically cache trace data and only rarely flush and send trace data back to the main process. This helps to minimize the runtime overhead of tracing since sending trace data over IPC can be an expensive operation. So, to end tracing, Chromium asynchronously asks all child processes to flush any pending trace data.
Trace data will be written into resultFilePath. If resultFilePath is empty
or not provided, trace data will be written to a temporary file, and the path
will be returned in the promise.
contentTracing.getTraceBufferUsage()
History
| Version(s) | Changes |
|---|---|
None | This method now returns a Promise instead of using a callback function. |
Returns Promise<Object> - Resolves with an object containing the value and percentage of trace buffer maximum usage
valuenumberpercentagenumber
Get the maximum usage across processes of trace buffer as a percentage of the full state.
contentTracing.enableHeapProfiling([options]) Experimental
History
| Version(s) | Changes |
|---|---|
>=43.0.0 | API ADDED |
Returns Promise<void> - Resolves once heap profiling has been enabled.
Enable heap profiling
for MemoryInfra traces. Equivalent to the --memlog switch in Chrome.
Only takes effect if the disabled-by-default-memory-infra category is included.
Needs to be called before contentTracing.startRecording().
Usage:
const { contentTracing } = require('electron')

async function recordTrace () {
  await contentTracing.enableHeapProfiling()
  await contentTracing.startRecording({
    included_categories: ['disabled-by-default-memory-infra'],
    excluded_categories: ['*'],
    memory_dump_config: {
      triggers: [
        { mode: 'detailed', periodic_interval_ms: 1000 }
      ]
    }
  })

  await new Promise(resolve => setTimeout(resolve, 5000))

  const filePath = await contentTracing.stopRecording()
}
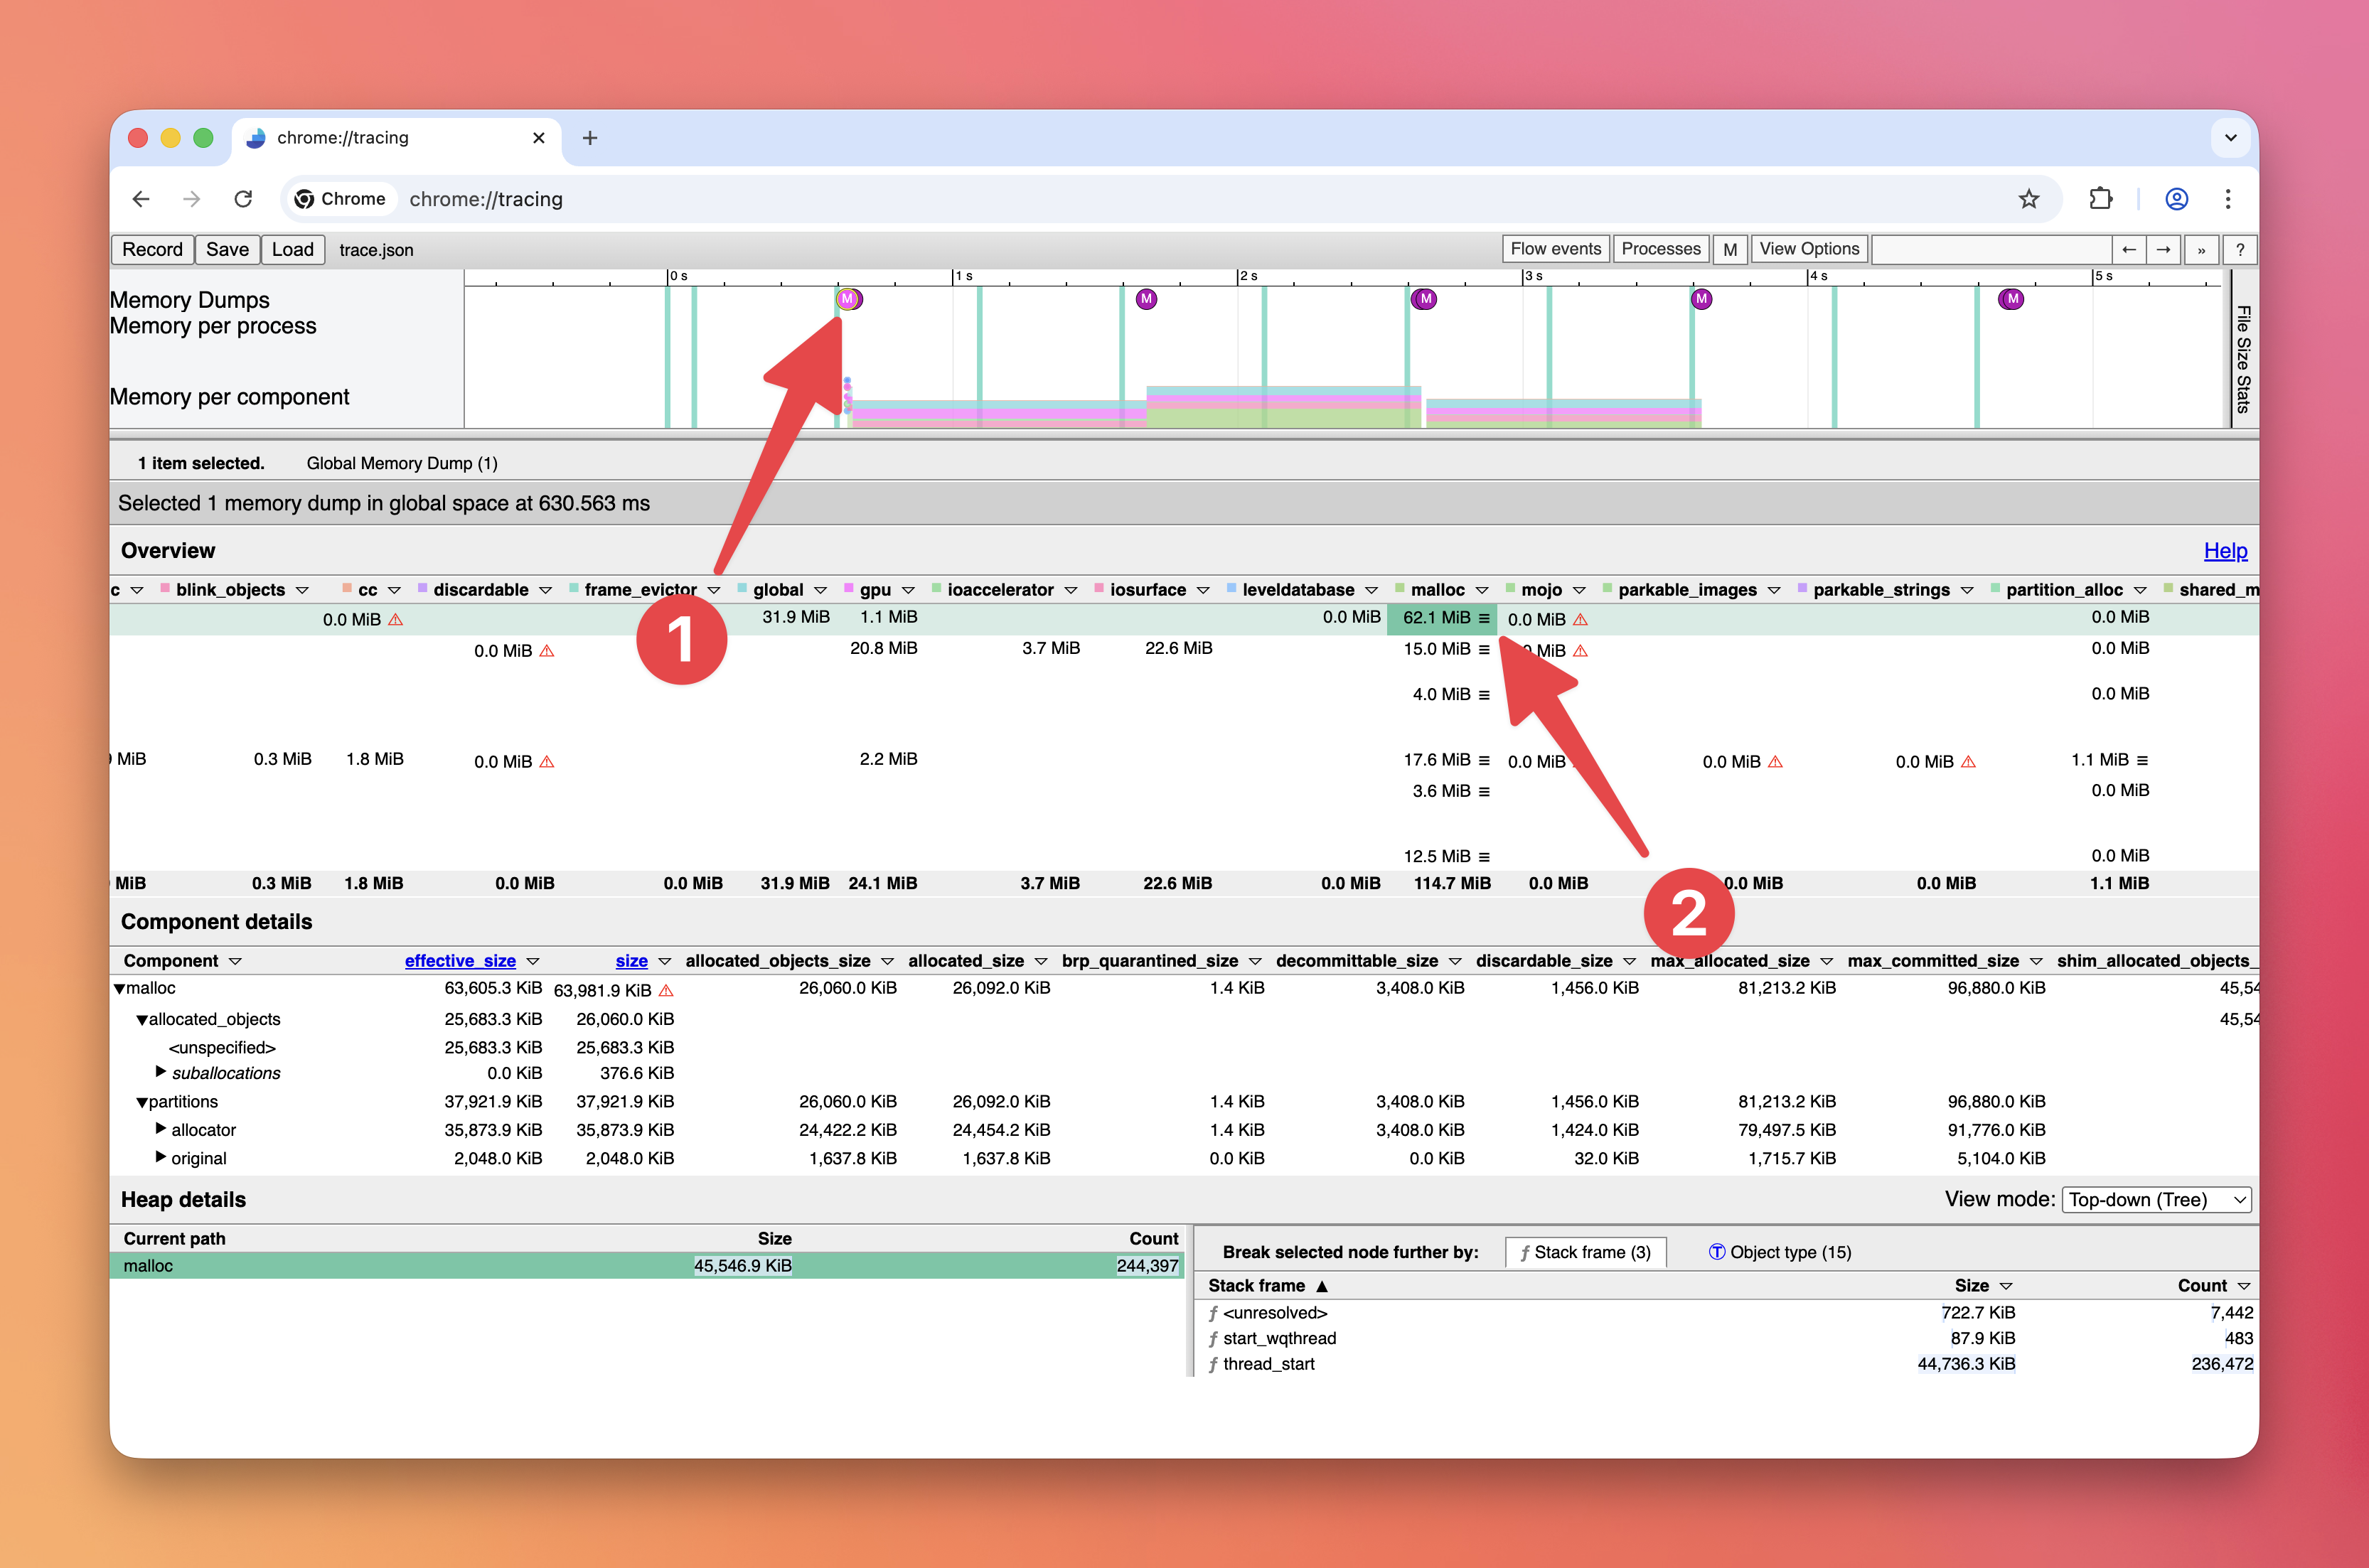
To view the recorded heap dumps:
-
Download the breakpad symbols for your Electron version from the Electron GitHub releases
-
Clone the Electron source code
-
In your Chromium checkout for Electron, run this command to symbolicate the heap dump:
python3 third_party/catapult/tracing/bin/symbolize_trace --use-breakpad-symbols --breakpad-symbols-directory /path/to/breakpad_symbols /path/to/trace.json -
Open the symbolicated trace in
chrome://tracing(the Perfetto UI does not support memory dumps yet) -
Click on one of the
Msymbols -
Click on a
☰triple bar icon (e.g., in themalloccolumn)